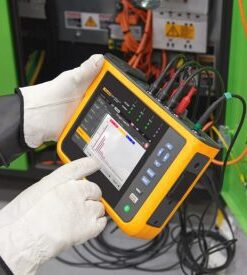
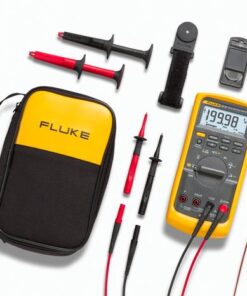
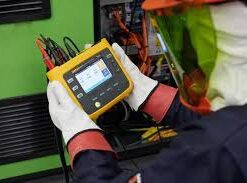
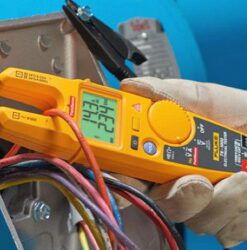
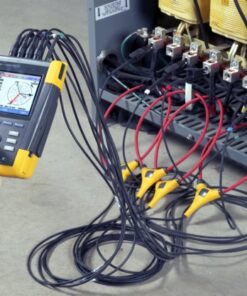
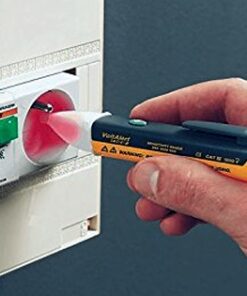
|
Waveform Pass / Fail Testing |
 |
Pass/Fail testing
of actual signal against a reference template.
|
|
|
Waveform reference’ allows an acquired trace to be stored and designated
‘reference trace’ for visual comparisons, or it can be used as the
reference for automatic ‘Pass / Fail’ testing (190C). Up to 100
individually matching (‘Pass’) or non-matching (‘Fail’) waveforms can be
stored in the replay memory, allowing you to monitor your system’s
behaviour over a long period of time, without the need for you to attend! |
|
| |
Many more new
functions
|
 |
Variable gain on channel A helps you compare signals on the two inputs.
accidental ground short circuits (Fig.5). All inputs are safety
certified for measurements in 1000 V CAT II and 600 V
|
 |
The
Vpwm measurement is for measuring the effective RMS output voltage of
variable speed motor drives and frequency inverters.
|
 |
The
high-sensitivity setting of 2 mV/div allows for measurements on
low-level signals, that are hard to make with the average oscilloscope.
|
 |
Medical applications: For use on Medical Imaging Equipment and on
High-Resolution Video systems, an optional instrument configuration is
available. |
|
Use TrendPlot™ to help find intermittents, fast
|
|
 |
Cursors and zoom
help you analyse the captured TrendPlot
|
|
|
The
toughest faults to find are those that happen only once in a while:
intermit-tents. They can be caused by bad connections, dust, dirt,
corrosion or simply broken wiring or connectors. You may not be around to
see it - your Fluke ScopeMeter will. In this "paperless recorder" mode,
you can plot the minimum and maximum peak values and average over time -
up to 22 days (Fluke 190 Series) or 16 days (Fluke 120 Series). The two
inputs can plot any combination of voltage, current, temperature,
frequency and phase - with time and date stamp -to help lead you to the
cause of those faults quickly. |
|
| |
FlukeView® Software
for documenting, archiving and analysis
|
FlukeView® for Windows®
helps you get more out of your ScopeMeter by:
 |
Documenting - transfer waveforms, screens and measurement data from the
ScopeMeter to a PC. Print or import the data into your report
|
 |
Add
user text to individual ScopeMeter settings - providing guidance to the
operator when recalling a set-up. |
 |
Archiving - create a library of waveforms with your comments for easy
reference and comparison. Store complete Replay cycles for analysis of
waveform changes. Store complete memory content of the ScopeMeter.
|
 |
Waveform Compare - store reference waveforms on the PC, or send a
reference back to the ScopeMeter for waveform comparison and "Pass/Fail"
testing. |
 |
Analysis - use cursors, perform spectrum analysis or export data to
other analysis programs. ScopeMeter test tools are connected to a PC via
an optically-isolated RS-232 interface cable. |
|
|